Take complex and antiquated agricultural systems and distill them down into a streamlined mobile and tablet experience with offline capabilities.
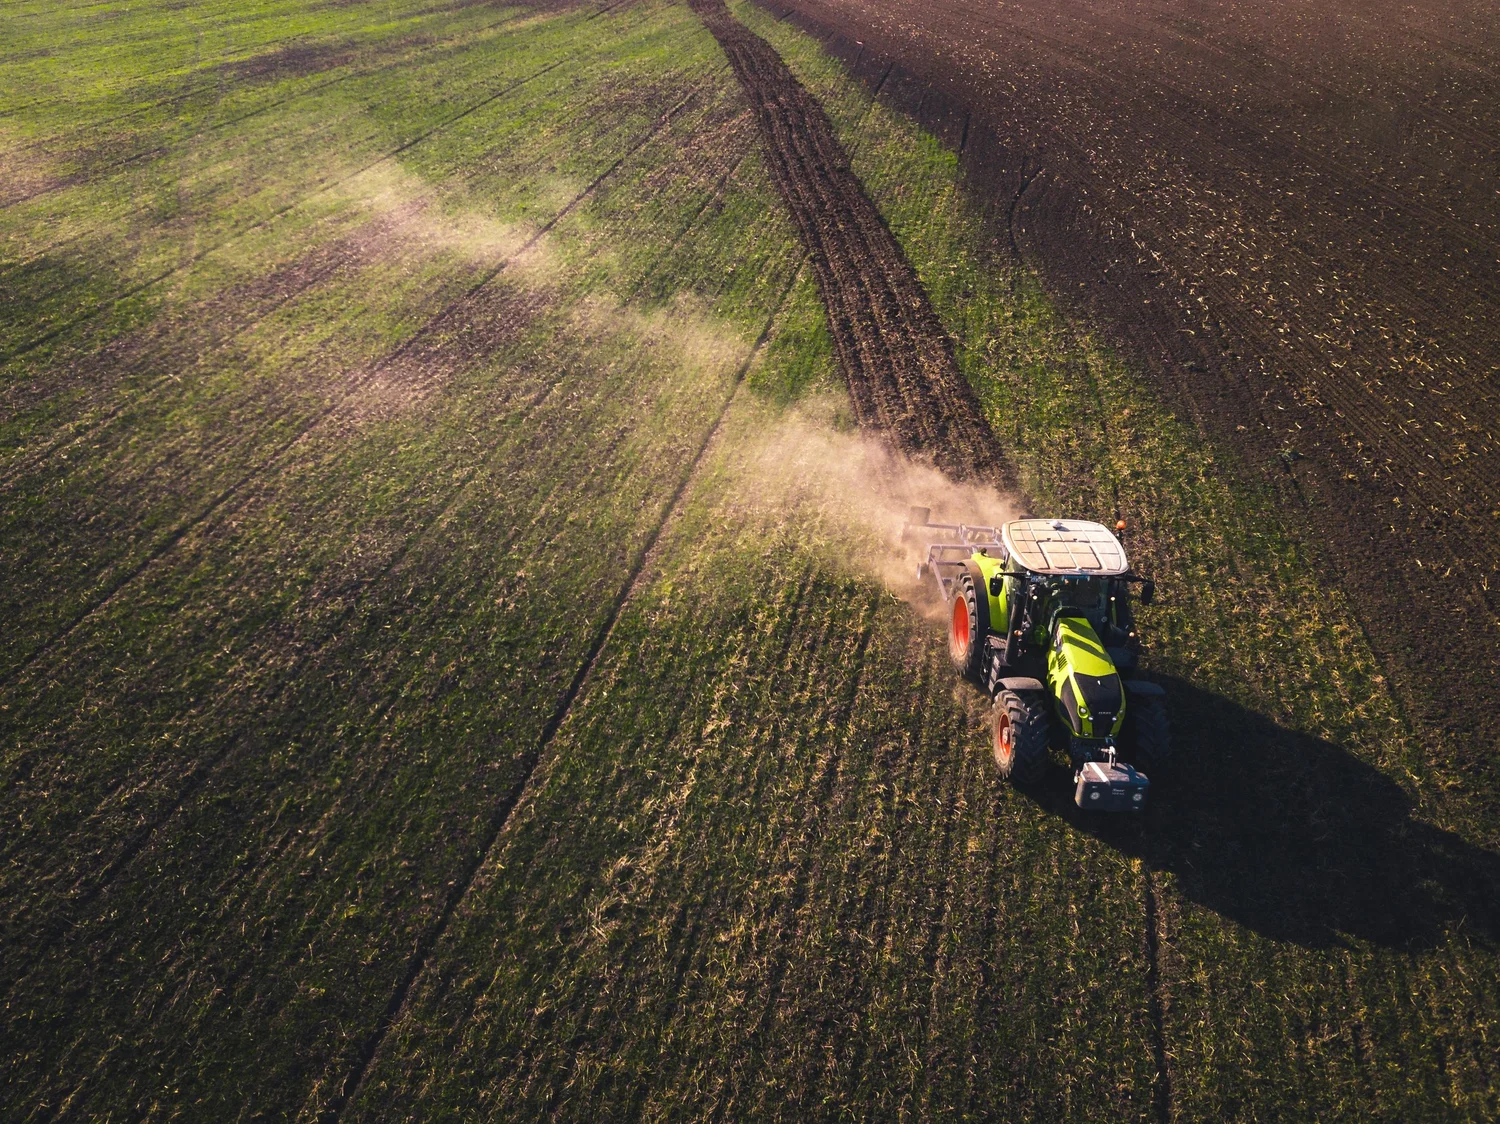
Simplot's field operators and growers relied on antiquated desktop tools to manage spatial data, crop scouting, and field-level actions. The existing systems were cluttered with inconsistent patterns, unclear hierarchy, and interfaces that assumed a desk and a large monitor. But the people using them were standing in fields, working under time pressure, often with spotty or no connectivity.
The core design challenge was balancing data density with clarity for a mobile-first product. Agricultural data is inherently complex: spatial coordinates, layered map data, crop types, pest observations, weather overlays, and farm associations all competing for screen real estate on a 6-inch display.
The goal: a powerful yet approachable product that enables confident navigation between overview and detail, designed for the conditions where it would actually be used.
I led end-to-end user flows in Figma with an emphasis on reusable, scalable components. The work spanned discovery research, interaction design, visual design, and design system documentation. I worked directly with growers, field operators, and the engineering team to ensure every design decision held up under real field conditions.
A significant part of the role was systems thinking: building a component library that could accommodate the full complexity of agricultural data without creating technical debt. Every map interaction, filter panel, and detail overlay needed to be consistent enough to feel familiar but flexible enough to handle wildly different data types.
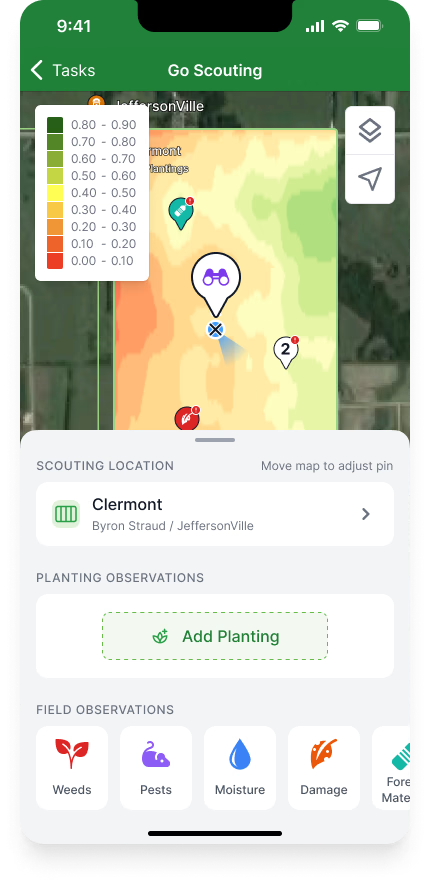
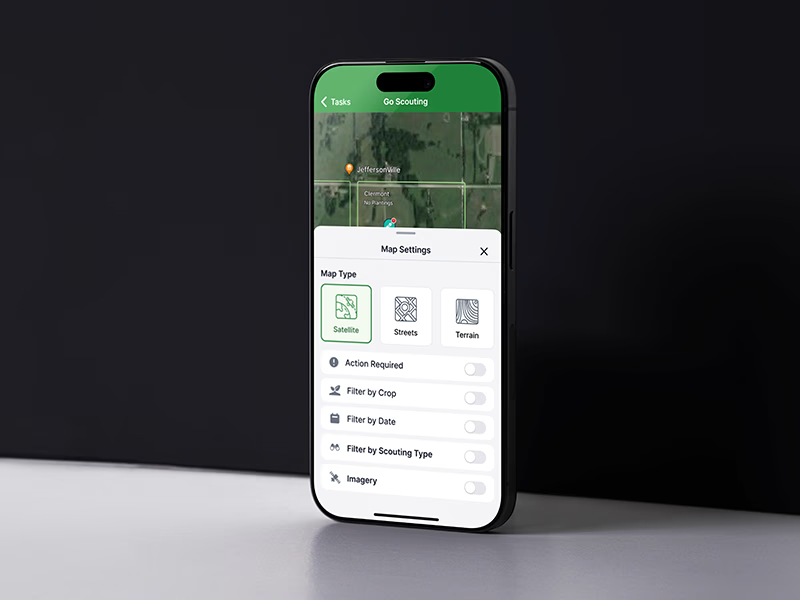
The central design insight was that maps function as primary interfaces, not backgrounds. The map wasn't a visual element that happened to show location data. It was the core interaction surface. Everything users needed to do started from the map: selecting fields, viewing spatial relationships, toggling data layers, and drilling into crop-level detail.
Navigation functions as interconnected components displaying comprehensive farm data: field selection, spatial relationships, crop types, and farm associations. The map contains multiple layers including PLSS data, terrain, and satellite overlays. Custom icons were created for all event instances across crop and pest types.
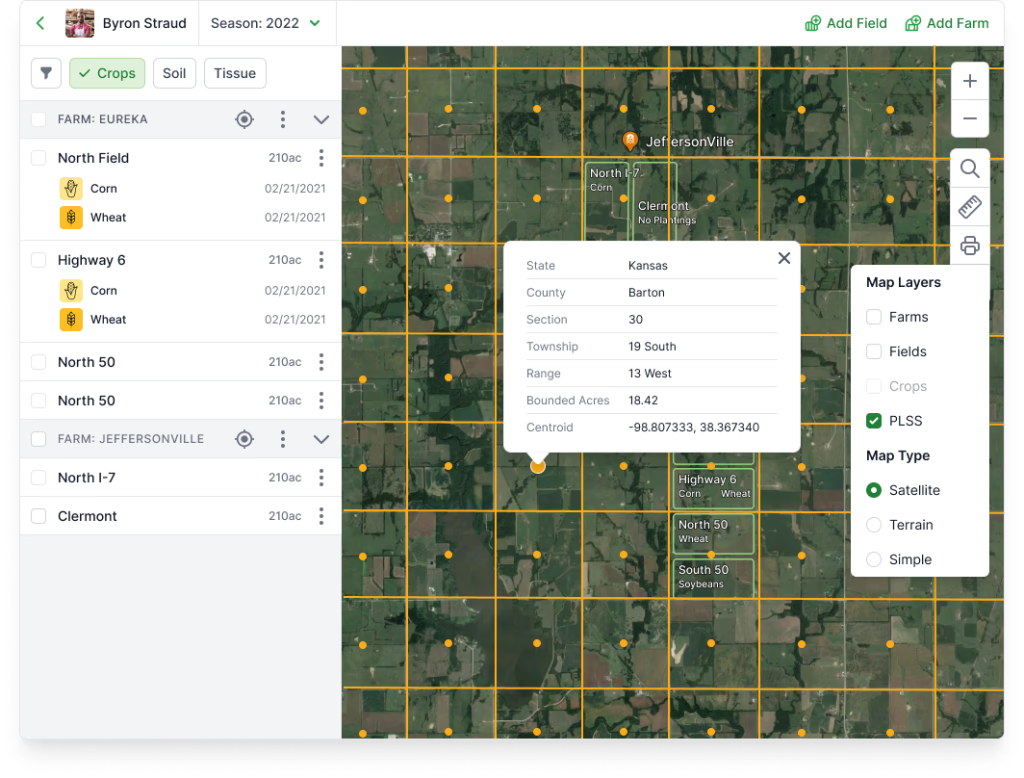
The design system evolved from Tailwind into a proprietary system purpose-built for the agricultural domain. Green and grey accents maintain simplicity, cleanliness, and accessibility across complex components. The library was continuously expanding, driven by collective foundational pieces that ensured consistency as new features shipped.
Every component was designed to work in field conditions: high contrast for outdoor visibility, large touch targets for gloved hands, and clear state indicators that could be read at a glance. The system documented not just visual specs but interaction patterns, ensuring engineering could build consistent behavior across the entire product.
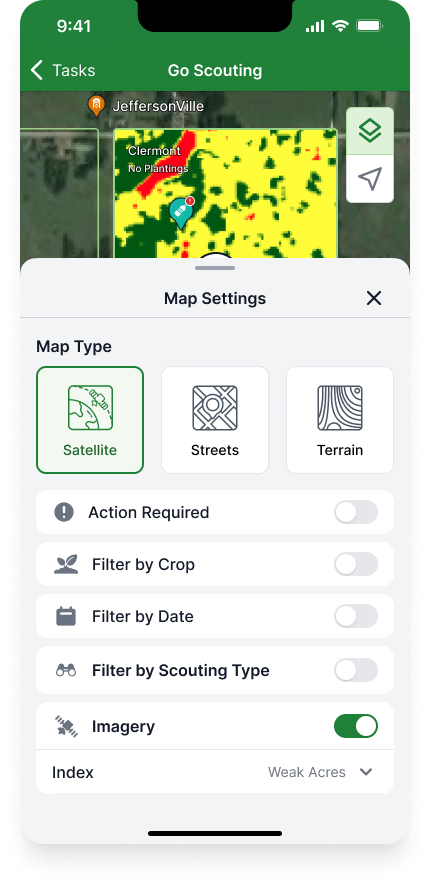
The product was designed for field conditions with minimal or no connectivity. This wasn't a nice-to-have feature. It was a core requirement that shaped every design decision. UI elements were exportable as PDFs or images for sharing with stakeholders who might not have app access. Local data download and storage functionality ensured operators could continue working regardless of signal strength.
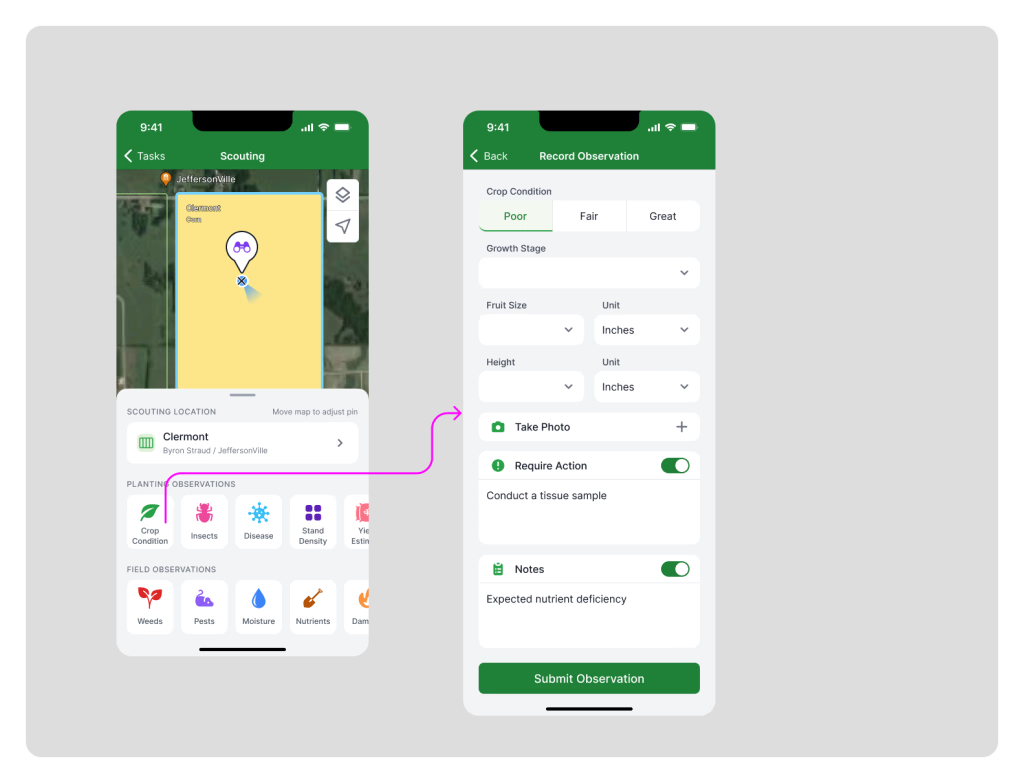
The mobile scouting feature supported 14 observation types plus a null state, each with custom illustrations and icons. The rapid 48-hour discovery-to-implementation cycle meant we could respond to field conditions as they evolved, shipping new observation types as crop seasons demanded them.
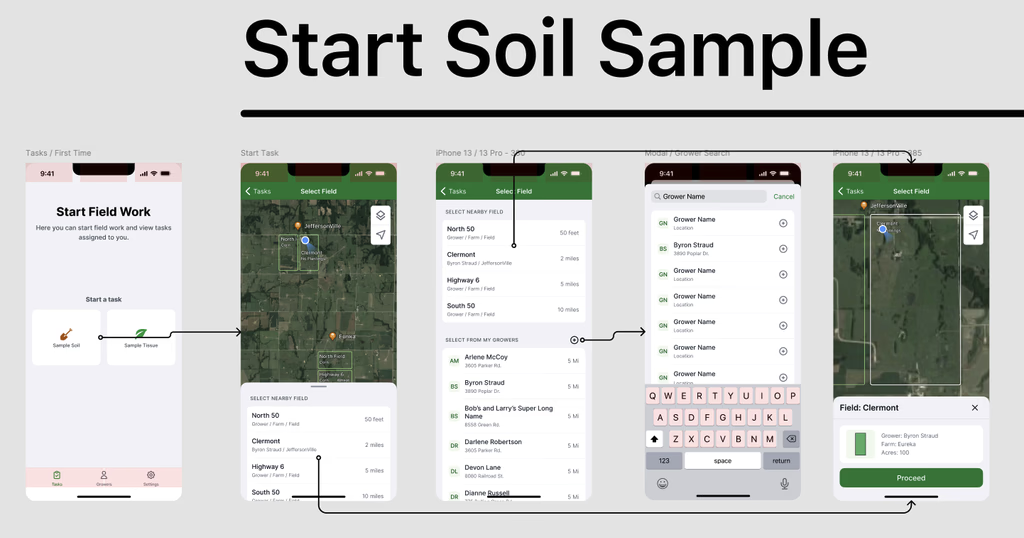
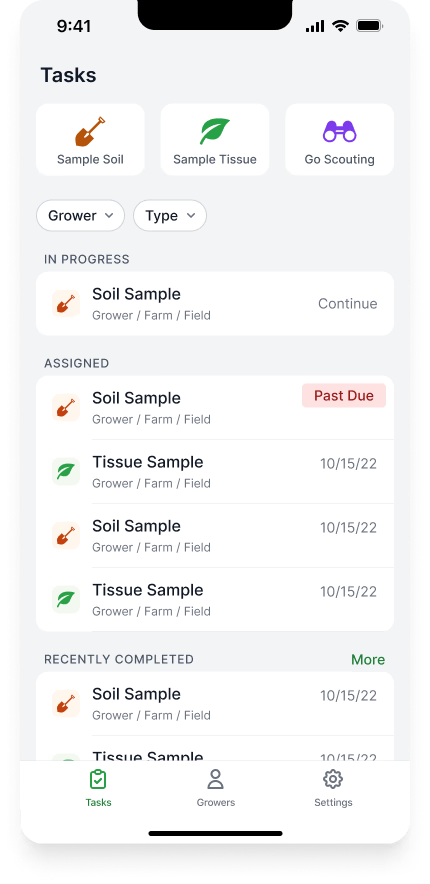
The mobile-first redesign moved critical agricultural workflows out of the office and into the field where decisions actually happen. Agronomists and field scouts could record observations, review scouting data, and manage tasks without returning to a desktop. Offline-first architecture meant connectivity was no longer a prerequisite for productivity.
The map-as-primary-interface approach fundamentally changed how users interacted with farm data. Instead of navigating through menus and tables, every interaction started from spatial context. The proprietary design system evolved from Tailwind into a domain-specific library that shipped new features consistently as crop seasons demanded them, with the 48-hour sprint cadence keeping pace with field conditions.